| Feature | VictoriaMetrics | Prometheus |
|---|---|---|
| Architecture | Single-node and clustered | Single-node |
| Performance | High ingestion and query throughput | Efficient for medium-scale setups |
| Scalability | Horizontally scalable in clustered mode | Limited to vertical scaling |
| Data Compression | Advanced compression techniques for cost efficiency | Basic compression |
| Data Model | Multi-dimensional (similar to Prometheus) | Multi-dimensional with key/value pairs |
| Query Language | PromQL | PromQL |
| Data Collection | Supports Prometheus scraping | Pull-based model (scraping) |
| Alerting | Requires external integration (Alertmanager) | Built-in Alertmanager |
| Long-Term Storage | Designed for efficient long-term storage | Typically complemented with remote storage solutions |
| Multi-Tenancy | Supported | Not natively supported |
| Global Querying | Supported in clustered mode | Not supported |
| Compatibility | Integrates with Prometheus ecosystem | Native component of Prometheus ecosystem |
| Ease of Use | More complex setup for clustered mode | Simple and straightforward setup |
| Use Case | Large-scale, high-performance, long-term storage | Medium-scale, immediate querying, and alerting |

VictoriaMetrics and Prometheus are both popular tools in the realm of time-series data storage and monitoring, but they have different focuses and features. Here’s a comparative overview:
Prometheus
Overview: Prometheus is an open-source systems monitoring and alerting toolkit originally built at SoundCloud. Since its inception, it has become a foundational component of many monitoring systems, particularly within the cloud-native ecosystem.
Key Features:
- Data Model: Prometheus uses a multi-dimensional data model with time series data identified by metric name and key/value pairs.
- PromQL: Prometheus Query Language (PromQL) allows for powerful and flexible querying of time-series data.
- Pull Model: Prometheus primarily uses a pull-based model for collecting metrics, scraping them from instrumented targets.
- Alerting: It includes a built-in alert manager that supports defining and managing alert rules and notifications.
- Self-Contained: Prometheus is designed to be a self-contained system that can operate independently, with local storage optimized for reliability and performance.
- Ecosystem: Prometheus is part of the Cloud Native Computing Foundation (CNCF) and integrates well with Kubernetes and other cloud-native tools.
Limitations:
- Scalability: While Prometheus is highly performant for many use cases, its single-node architecture can limit scalability for very large workloads.
- Long-Term Storage: Prometheus’ local storage is not ideal for long-term storage of metrics. It is usually complemented with remote storage solutions for this purpose.
VictoriaMetrics
Overview: VictoriaMetrics is a high-performance, cost-effective, and scalable time-series database designed to handle large-scale monitoring and observability workloads. It can be used as a replacement for Prometheus’ storage layer.
Key Features:
- High Performance: VictoriaMetrics can handle high ingestion rates and large volumes of data efficiently, often outperforming Prometheus in write and query throughput.
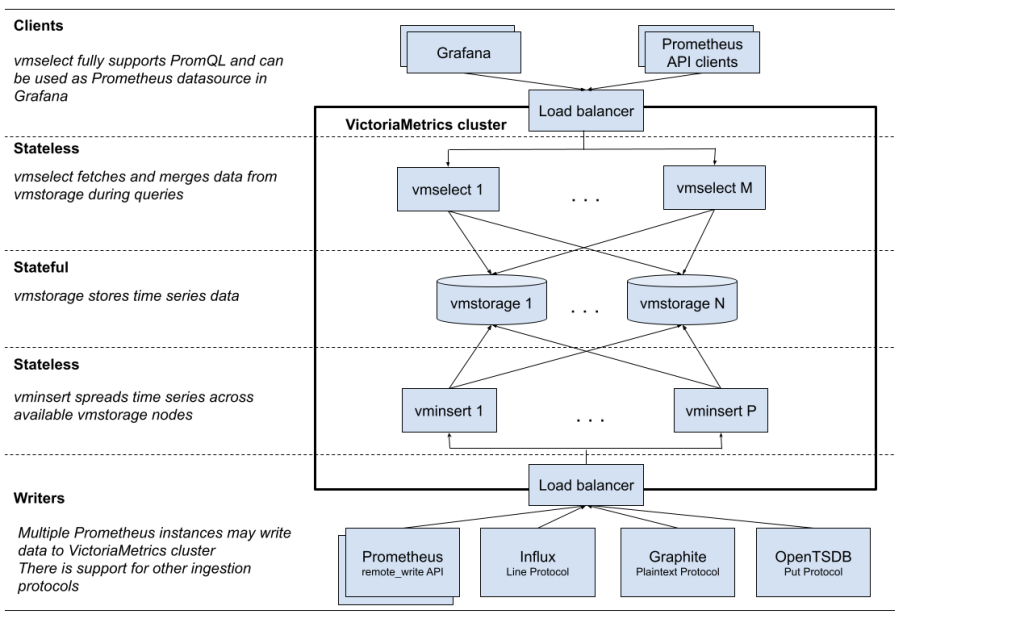
- Scalability: It supports both single-node and clustered modes, enabling horizontal scaling to handle larger datasets and higher query loads.
- Data Compression: It uses advanced data compression techniques, resulting in lower storage costs and faster query responses.
- Compatibility with Prometheus: VictoriaMetrics can ingest data from Prometheus and supports PromQL, making it easy to integrate with existing Prometheus setups.
- Multi-Tenancy: VictoriaMetrics supports multi-tenancy, allowing multiple teams or users to share the same database instance without interfering with each other.
- Global Querying: In a clustered setup, VictoriaMetrics supports global querying, providing a unified view of data across all nodes.
Use Cases:
- Large-Scale Monitoring: For organizations that need to handle high volumes of metrics data, such as those running extensive cloud infrastructure or IoT deployments.
- Long-Term Storage: VictoriaMetrics is suitable for long-term storage of metrics data due to its efficient data compression and cost-effective storage.
Complementary Use:
- Remote Write Integration: Prometheus can be configured to use VictoriaMetrics as a remote storage backend. This setup allows users to leverage Prometheus’ rich feature set while benefiting from VictoriaMetrics’ scalability and performance for storage and querying.
Choosing Between Them
- Prometheus: Best suited for smaller to medium-scale setups or as a standalone monitoring and alerting solution within cloud-native environments.
- VictoriaMetrics: Ideal for large-scale or high-performance environments, particularly when long-term storage and efficient data handling are critical.